3. Color and Visual Perception
In chapter 2 we turned a picture into a grid of numbers: every pixel stores three values, R, G and B.
But we never asked what those three numbers mean.
Why three, and not five or ten?
Why does a "50% gray" pixel with the value 128 send out only about a fifth of the light of a white pixel?
And why do two shirts that match perfectly in the shop look different at home?
All of these questions have the same answer: color is not a property of light alone, it is what our eyes and brain make of light.
CG produces images for human eyes, so in this chapter we'll follow light from the lamp to the brain and see how every step shows up in graphics: in the RGB values of a texture, in the color spaces of a video file, in the gamma curve of a monitor and in the tricks our perception plays on a shaded polygon.
Syllabus items covered in this chapter:
- Area 1, digital image basics (ディジタル画像の基礎): how color is represented, color systems (表色系) and color spaces.
- Area 9, perception (知覚): the color and vision part (the eye, brightness perception, contrast effects, resolution of the eye, depth cues).
- A first look at color conversions, which area 6 (濃淡変換と色変換, chapter 15) uses in image processing.
The only math we need is weighted sums and one matrix–vector product, both from the Linear Algebra series.
3.1 Light and spectra
Light is an electromagnetic wave
Light is an electromagnetic wave (電磁波), just like radio waves and X-rays, only with a much shorter wavelength (波長).
Our eyes react to wavelengths from roughly 380 nm to 780 nm (1 nm = one millionth of a millimeter).
This band is called visible light (可視光).
Below it lies ultraviolet (紫外線), above it infrared (赤外線).
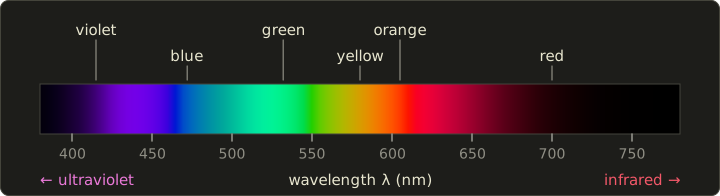
Light of a single wavelength is called monochromatic light (単色光).
When we spread white sunlight with a prism, we see the monochromatic colors side by side: violet, blue, green, yellow, orange, red.
The band names are only rough labels; the colors change smoothly, and the borders between them are a matter of convention.
Note: The strip above is an approximation. Pure spectral colors are more saturated than any normal screen can show, so I had to wash them out slightly; we'll see why in section 3.4. The dark ends are real, though: our eyes are very insensitive near 380 nm and 780 nm.
The spectral distribution
Real light is almost never a single wavelength.
A lamp, the sky or a sheet of paper sends out a mixture of all visible wavelengths, each with its own strength.
The graph "strength per wavelength" is called the spectral distribution (分光分布), or spectral power distribution, SPD for short.
A surface has a similar curve, its spectral reflectance (分光反射率): the fraction of the light at each wavelength that it bounces back.
The light that reaches our eye from a surface is, wavelength by wavelength, the light source's spectrum times the surface's reflectance.
A spectrum is a whole curve, potentially hundreds of numbers.
Yet a pixel stores three.
The reason three are enough lies in the eye.
3.2 The eye: rods, cones and three numbers
Rods and cones
At the back of the eye is the retina (網膜), covered with light-sensitive cells of two kinds.
- Rods (桿体, kantai): about 90 million or more per eye, very sensitive, work in dim light (scotopic vision, 暗所視). There is only one type of rod, so they can't tell colors apart; this is why we see in shades of gray by moonlight. They are most sensitive around 500 nm.
- Cones (錐体, suitai): about 6 million per eye, packed most densely in the fovea (中心窩), the center of our vision. They need more light (photopic vision, 明所視) and come in three types: S, M and L, for short, medium and long wavelengths.
The three cone types are sensitive to broad, overlapping ranges of wavelengths, with their peaks at very roughly 420 nm (S), 530 nm (M) and 560 nm (L).
Each cone type adds up all the light it receives, weighted by its sensitivity curve, and reports a single number.
Whatever the spectrum looks like, the brain receives only three numbers per point: the S, M and L responses.
That is the whole secret of RGB.
Trichromacy and the opponent process
The idea that color vision rests on three kinds of receptors is the trichromatic theory (三色説), also called the Young–Helmholtz theory.
It explains why mixing three primaries can imitate (almost) any color.
It doesn't explain everything, though: nobody has ever seen a "reddish green" or a "yellowish blue", while orange (reddish yellow) is fine.
Hering's opponent-process theory (反対色説) explains this: after the cones, the visual system recombines the signals into three opposing channels, red–green, yellow–blue and light–dark.
Today both are considered correct, at different stages: trichromacy in the cones, opponent channels in the nerves behind them (the zone or stage theory, 段階説).
As we'll see in section 3.6, video formats copy the second stage: one light–dark channel plus two color-difference channels.
Metamerism
Because the eye throws the spectrum away and keeps three numbers, two different spectra can produce the same three cone responses.
They then look exactly the same.
This is called metamerism (条件等色, or メタメリズム), and the two lights are metamers.
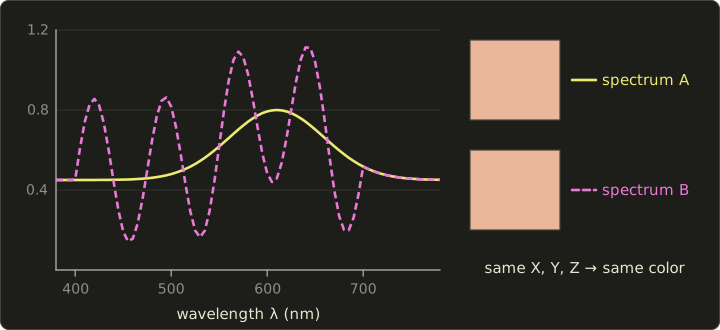
I constructed spectrum B above from A by adding a wave that the standard observer of section 3.4 cannot see at all (its weighted sums are exactly zero), so the X, Y, Z values of both are identical.
Metamerism is what makes CG and displays possible at all: a monitor can't reproduce the spectrum of a sunset, but it doesn't have to.
It only has to produce a spectrum (from its red, green and blue lights) that is a metamer of the sunset.
It also explains the shirt in the shop: two fabrics that are metamers under the shop's lamps can stop being metamers under daylight, because the light's spectrum changed.
Color vision deficiency
When one cone type is missing or shifted, color vision has fewer than three independent channels.
Depending on the cone type, this is called protan (L cones), deutan (M cones) or tritan (S cones) color vision deficiency (色覚異常).
Red–green deficiencies (protan and deutan) are by far the most common: they affect about 8% of men of Northern European descent, about 5% of Japanese men, and well under 1% of women.
For CG and UI design this has a practical consequence: never let color alone carry important information (for example "red = enemy, green = friend"); add shape, text or brightness differences too.
3.3 Additive and subtractive mixing
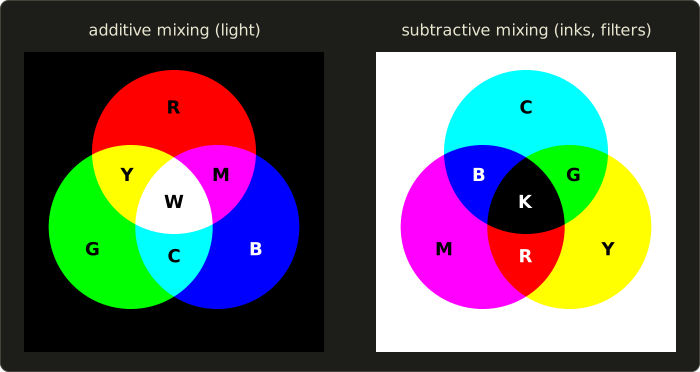
Additive mixing (加法混色) adds lights.
Its primaries (原色) are red, green and blue (R, G, B).
Each light adds its own wavelengths, so mixtures get brighter: red + green = yellow, green + blue = cyan, blue + red = magenta, and all three give white.
Displays work this way: every pixel is three tiny lights.
Subtractive mixing (減法混色) stacks filters or inks on white paper.
Each ink absorbs part of the light: cyan absorbs red, magenta absorbs green, and yellow absorbs blue.
Mixtures get darker: cyan + magenta = blue, magenta + yellow = red, yellow + cyan = green, and all three give (ideally) black.
Printers, paint and photographic film work this way.
The secondary colors of one system are the primaries of the other.
For values in the range 0 to 1, the conversion is simple:
Why printers add K
Real inks are not ideal filters, so C + M + Y at full strength gives a muddy dark brown, not black.
Black text would also need three layers of ink exactly on top of each other, which wastes ink, takes longer to dry and blurs if the layers are slightly misaligned.
Printers therefore add a fourth ink, black, called K (from "key plate").
The simplest conversion takes the common gray part out of C, M, Y and prints it with K:
(when the color is pure black, and ).
Worked example. Convert RGB to CMY and CMYK.
- CMY: , , .
- , and .
- , , .
- Result: CMYK . One ink is always 0 after this step.
Real print workflows use measured profiles (ICC profiles) instead of these formulas, because ink, paper and press all change the result, but the formulas are what's worth knowing for the exam.
3.4 CIE XYZ and the chromaticity diagram
RGB values depend on the device: "R = 1" means a different red on every monitor.
To talk about colors precisely, we need a device-independent system.
That's what the CIE (International Commission on Illumination) defined in 1931.
Color matching and the XYZ color system
In color matching experiments (等色実験), observers looked at a split field: one half showed a monochromatic test light, and the other half a mixture of three primary lights that the observer adjusted until both halves matched.
The result is a table: for every wavelength, how much of each primary is needed.
For some wavelengths, no positive mixture matched; the observer had to add a primary to the test side instead, which counts as a negative amount.
The CIE transformed these results into the XYZ color system (XYZ表色系), whose three primaries are imaginary (no real light could produce them) but chosen so that every real color has positive X, Y and Z.
The three curves that say how much each wavelength contributes are the color matching functions (等色関数) , , of the standard observer:
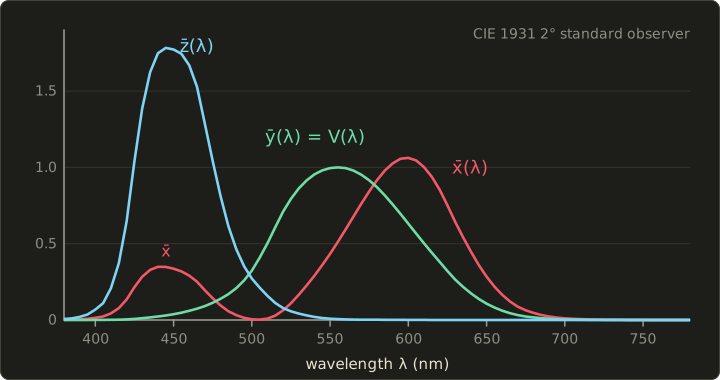
The tristimulus values (三刺激値) of a light with spectrum are its weighted sums:
(the official definition uses integrals; with tabulated data at 5 nm or 1 nm steps you add up the products like this, which is just a dot product of two long vectors, see Linear Algebra chapter 4).
One choice makes XYZ especially useful: is exactly the luminous efficiency function (標準比視感度), the eye's brightness sensitivity in daylight, which peaks at 555 nm.
So Y is the luminance (輝度) of the color, and X and Z carry the color information.
That's also why green looks so much brighter than blue at the same power: the curve is high at 555 nm and low at 450 nm.
From XYZ to xy
To separate "which color" from "how bright", we divide by the sum:
The pair is the chromaticity (色度) of the color.
Since follows from and , two numbers are enough, and the full color is often given as : chromaticity plus luminance.
Doubling the brightness of a light doubles X, Y and Z, so and don't change.
A white and a gray of the same hue therefore sit on the same point.
Reading the chromaticity diagram
Plotting all colors by gives the famous horseshoe, the xy chromaticity diagram (xy色度図).
I computed the one below from the official CIE 1931 data, so the shape and the wavelength marks are exact.
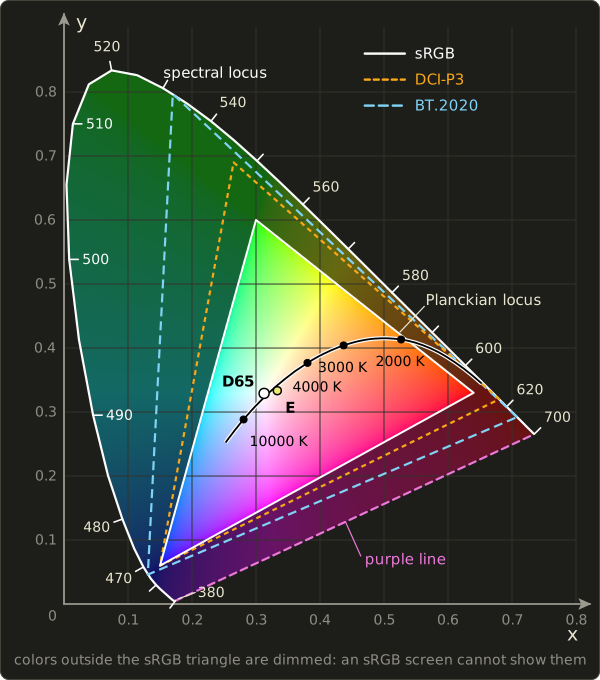
- The spectral locus (スペクトル軌跡): the curved edge. It is the path of the monochromatic colors from 380 nm (bottom left) through 520 nm (top) to 700 nm (right). These are the most saturated colors that exist.
- The purple line (純紫軌跡): the straight edge joining the two ends. Its colors (purples and magentas) are mixtures of red and violet; no single wavelength produces them.
- Every real color lies inside this region, and nothing outside it can be seen. The closer to the edge, the more saturated (pure) the color; the closer to the white point, the paler.
- White points (白色点): E at is the "equal energy" white with a flat spectrum. D65 at is the CIE's standard average daylight and the white of sRGB and HDTV.
- Mixing is a straight line. Mixing two lights gives a color on the straight line between their points; mixing three gives a color inside their triangle.
The last point is why a display has a triangular gamut (色域): with three primaries R, G, B, a screen can show exactly the colors inside the triangle they span.
No triangle with real primaries can cover the horseshoe, because the horseshoe is curved, so no three-primary display can show all colors.
In the diagram, everything outside the sRGB triangle is drawn dimmed: if you're reading this on a normal sRGB screen, those colors can't be displayed correctly, so I can only hint at them.
The sRGB primaries and the RGB → XYZ matrix
The sRGB color space (IEC 61966-2-1), the default color space of the web, of Windows and of most images, uses the same primaries and white as HDTV (ITU-R BT.709):
| x | y | |
|---|---|---|
| Red | 0.6400 | 0.3300 |
| Green | 0.3000 | 0.6000 |
| Blue | 0.1500 | 0.0600 |
| White (D65) | 0.3127 | 0.3290 |
From these four points one can compute the matrix that turns linear sRGB values (amounts of light, section 3.7) into XYZ.
It is a plain matrix–vector product (Linear Algebra chapter 6):
Each column is the XYZ of one primary at full strength, and the inverse matrix (chapter 10) goes back from XYZ to RGB.
Look at the middle row: .
That's the luminance of an sRGB color, and we'll meet these exact numbers again in section 3.6.
Worked example 1: where is sRGB red? Take .
- The matrix picks the first column: , , .
- Sum: .
- and : exactly the red primary from the table, as it should be.
Worked example 2: white and gray. Take .
Each row is multiplied by 0.5 and summed: , , .
Sum , so , : the D65 white point.
Any gray, from black to white, has the chromaticity of the white point; only Y differs.
Worked example 3: mixing on a straight line. Mix full red and full green: , yellow.
- XYZ of the mixture is the sum of the two columns: , , .
- Sum , so and .
- Red's column sums to and green's to . The mixture lies on the line from red to green at the fraction of the way.
- Check: and . Same point.
So the mixture is on the straight line, but not at the midpoint: each color pulls with the weight , not with its luminance or its RGB value.
Wider gamuts
sRGB's triangle is fairly small.
Newer standards push the primaries outward:
| Color space | Red (x, y) | Green (x, y) | Blue (x, y) | White | xy area vs sRGB |
|---|---|---|---|---|---|
| sRGB / BT.709 | 0.640, 0.330 | 0.300, 0.600 | 0.150, 0.060 | D65 | 1.00 |
| DCI-P3 | 0.680, 0.320 | 0.265, 0.690 | 0.150, 0.060 | 0.314, 0.351 | 1.36 |
| BT.2020 | 0.708, 0.292 | 0.170, 0.797 | 0.131, 0.046 | D65 | 1.89 |
DCI-P3 (SMPTE RP 431-2) is the gamut of digital cinema projection; "Display P3", used by many phones and laptops, takes the same primaries with the D65 white and the sRGB curve.
BT.2020 is the gamut of UHDTV (4K/8K); its primaries lie on the spectral locus itself, at 630 nm, 532 nm and 467 nm.
Keep in mind that the xy diagram isn't perceptually uniform (equal distances don't look equally different: the green area is stretched), so "1.89× the area" is not "1.89× as many visible colors".
Perceptual color systems
Because XYZ and xy aren't uniform, the CIE also defined the CIE 1976 color space (L*a*b*表色系, CIELAB), where equal distances roughly match equal visible differences; its lightness is (for all but the darkest values), with the white's luminance.
The older Munsell color system (マンセル表色系) arranges painted color samples by the three attributes of color (色の三属性): hue (色相), value or lightness (明度) and chroma or saturation (彩度).
These three attributes are also the idea behind HSV, our next topic.
Chapter 15 uses these spaces for color conversions in image processing.
3.5 HSV and HSL
RGB is how a screen works, but not how a person thinks about color.
"Make it a bit more orange" or "less vivid" is hard to express with R, G and B.
HSV describes a color by three more intuitive values:
- H, hue (色相): which color, as an angle on a color wheel: 0° red, 60° yellow, 120° green, 180° cyan, 240° blue, 300° magenta.
- S, saturation (彩度): how vivid, from 0 (gray) to 1 (pure color).
- V, value (明度): how bright, from 0 (black) to 1 (the brightest version of the color).
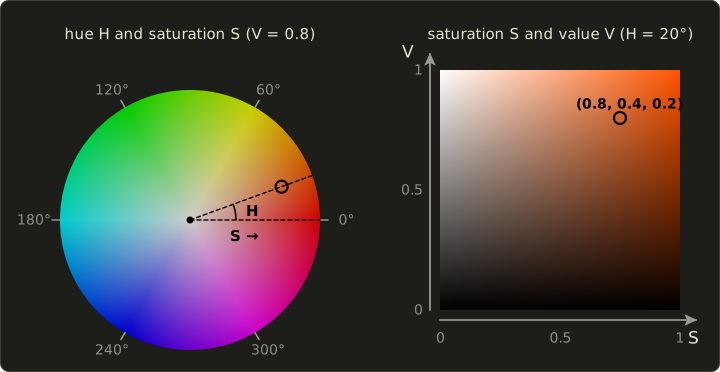
Geometrically, HSV is the RGB cube tipped onto its black corner and viewed along the gray diagonal: the cross-sections are hexagons, so the shape is often called the hexcone (六角錐) model.
RGB → HSV
With , let , and :
When the color is a gray and the hue is undefined (programs usually set it to 0).
Worked example. RGB , a brownish orange.
- (red), , .
- and .
- The maximum is R, so .
- HSV : a red-orange hue (between red 0° and yellow 60°), quite vivid, fairly bright.
HSV → RGB
Going back: (the "chroma"), , and .
Pick by the sector of the hue, then add to each:
| H | (R1, G1, B1) |
|---|---|
| 0° to 60° | (C, X, 0) |
| 60° to 120° | (X, C, 0) |
| 120° to 180° | (0, C, X) |
| 180° to 240° | (0, X, C) |
| 240° to 300° | (X, 0, C) |
| 300° to 360° | (C, 0, X) |
Worked example. HSV .
, , , so , and .
200° is in the 180°–240° sector: , plus : RGB , a grayish sky blue.
HSL (HLS)
HSL (also written HLS) uses lightness (明度/輝度, L) instead of value, with and .
In HSL, pure colors sit at , and both (black) and (white) are points, so the shape is a double hexcone (双六角錐).
For our example : , , and the hue is the same 20°.
In practice
Color pickers in paint programs, 3D tools and game engines show HSV or HSL, and shader effects like "shift the hue of this enemy" or "desaturate the screen when the player is hurt" are written in them.
HSV is just a reshuffled RGB, though: it says nothing about how bright a color looks.
Pure yellow and pure blue both have , but yellow looks far brighter.
For perceptual work, use luminance (Y) or a space like CIELAB.
3.6 Luma and chroma: YCbCr
Remember the opponent channels from section 3.2: the visual system separates "light–dark" from "color".
It also resolves fine detail mainly through the light–dark channel; our sharpness for color differences is much lower.
Video and JPEG exploit this by converting RGB into one brightness-like channel and two color-difference channels.
The formulas
The brightness-like channel is a weighted sum of R, G and B.
Two standards are in common use, and it's worth knowing which numbers belong to which:
The BT.709 weights are the middle row of the sRGB → XYZ matrix from section 3.4: they come from the modern HDTV primaries.
The BT.601 weights are older: they come from the primaries of the 1953 NTSC color TV standard and have stayed in SDTV and JPEG ever since.
In both cases green counts most and blue least, exactly as the curve suggests.
The two color-difference (色差) signals are scaled so that they run from −0.5 to +0.5:
(the divisors are , , and likewise for BT.709).
The prime marks matter: these formulas are applied to the gamma-encoded values (section 3.7), not to linear light.
The result is therefore called luma (ルーマ), and it is only an approximation of the true luminance Y.
Many books and APIs say "YUV" for this whole family; strictly, YUV is the analog PAL version, and YCbCr the digital one.
Worked example. The encoded color :
- BT.601: .
- and .
- BT.709: , , .
- The same pixel gets a different luma under the two standards. Decoding a BT.709 video with BT.601 numbers (a common bug) shifts the colors slightly: skin tones turn a little too green or too red.
Stored as 8-bit numbers, digital video traditionally uses the "limited range" 16–235 for Y' and 16–240 for Cb and Cr, while JPEG uses the full 0–255 with 128 added to Cb and Cr.
Chroma subsampling
Once luma and chroma are separate, we can store the chroma at a lower resolution and the eye barely notices.
This is chroma subsampling (クロマサブサンプリング, also called 色差サブサンプリング or 色差間引き), written as J:a:b for a block of 4 × 2 pixels:
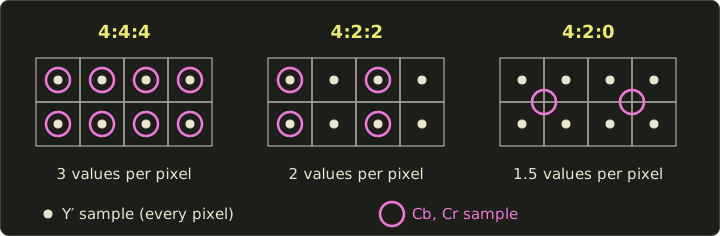
- 4:4:4: full chroma, 3 values per pixel. Used for high-end production and for screen content like text and UI.
- 4:2:2: chroma at half the horizontal resolution, 2 values per pixel. Common in broadcast and professional video.
- 4:2:0: chroma at half the resolution in both directions, 1.5 values per pixel. Used by almost all consumer video (Blu-ray, streaming) and by most JPEG files.
For a 1920 × 1080 frame at 8 bits per value, that's bytes for 4:4:4, bytes for 4:2:2 and bytes for 4:2:0: half the data before any real compression starts.
Chapter 2 showed what JPEG does next with the high frequencies.
The price is visible on sharp, saturated edges, for example red text on a blue background, which gets blurry colored fringes.
3.7 Gamma and the sRGB transfer function
The display's response
Old CRT monitors didn't produce light in proportion to the signal.
The light output followed a power curve, roughly
where is the signal (0 to 1) and the light (0 to 1).
A signal of 0.5 gave only of the full light.
To get a correct picture, video signals were sent pre-corrected with the inverse power, .
This pre-correction is gamma correction (ガンマ補正).
Modern LCD and OLED panels have no physical reason for such a curve, but they imitate it on purpose, and there's a very good reason to keep it.
Why the curve is still useful
Our sensitivity to brightness differences is roughly relative (the Weber–Fechner law, section 3.9): a step of 1 cd/m² is obvious in a dark scene and invisible in a bright one.
If we stored 8-bit values in proportion to light, we'd waste most of the 256 codes on bright tones we can't tell apart and have too few for the dark tones, where we'd see bands.
A power curve with exponent spends the codes much more evenly in terms of what we perceive, so 8 bits are just about enough.
Gamma encoding is a compression trick that matches the eye, and that's why all ordinary 8-bit images (PNG, JPEG, your screenshots) are stored encoded.
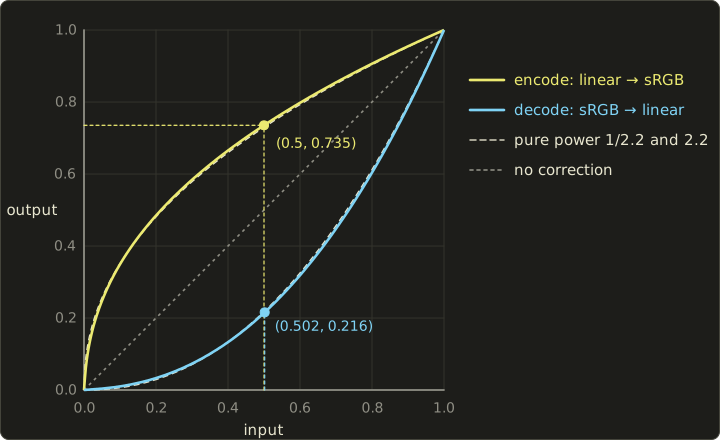
The exact sRGB curves
sRGB doesn't use a pure power of 1/2.2.
A pure power curve has an infinitely steep slope at 0, which amplifies noise in the darkest tones, so sRGB uses a short straight line near black and a power of 2.4 (shifted and scaled) everywhere else.
Encoding, from linear light to the stored value (IEC 61966-2-1):
Decoding, from stored back to linear :
The two pieces meet at , where .
Overall, the curve is very close to a pure power of 2.2, as the dashed lines in the plot show, which is why people say "sRGB is gamma 2.2".
Worked example 1: linear 0.5 → sRGB.
- , so we use the power branch.
- (on a calculator: ).
- .
- As 8 bits: , which rounds to 188.
- With the pure 2.2 curve we would get , or 186. Close, but not the same.
Worked example 2: 8-bit 128 → linear.
- , above 0.04045.
- .
- .
- The "middle gray" 128 sends out only about 22% of the light of white. Half the light is 188, not 128.
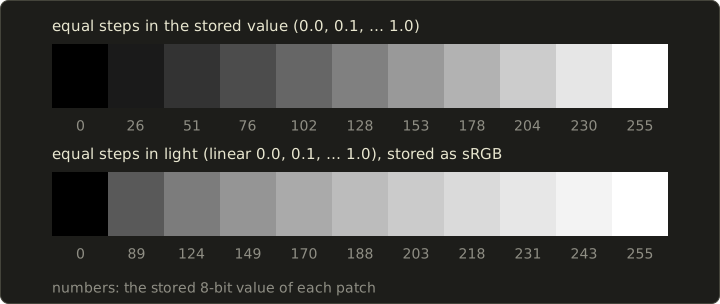
The two ramps above show it.
The top row steps evenly in stored value and looks like a fairly even staircase of brightness: that's the encoding working as intended.
The bottom row steps evenly in light: the first step from 0 to 10% of the light is already code 89, and the remaining nine steps squeeze into the bright end and look smaller and smaller.
Linear space vs sRGB space
Now the important consequence for CG: light adds up in linear space.
Two lamps that each give 0.25 of full light together give 0.5.
Physics happens in linear values, so all lighting, blending, filtering and averaging must be done on linear values, and only the final image is encoded to sRGB for the display.
What goes wrong if you skip this?
- Adding lights. Each lamp gives 0.25, stored as sRGB that's 0.537 (code 137). Adding the encoded values: , clipped to 1.0: pure white. The correct answer is linear 0.5, encoded 0.735 (code 188). The naive version is far too bright.
- Averaging (anti-aliasing, blur, mipmaps, resizing). A pixel half covered by a white edge on black should send out half the light: linear 0.5, code 188. Averaging the codes gives , which shows only 22% of the light: anti-aliased edges look too dark and thin, and blurred images get dark halos.
- Lighting in general. Diffuse lighting multiplies a surface color by the amount of light (chapter 10). If the surface color is still encoded, the falloff from lit to unlit looks too harsh and highlights change hue.
In practice
GPUs do the conversions for free in hardware:
- A texture with an sRGB format (
GL_SRGB8_ALPHA8in OpenGL,VK_FORMAT_R8G8B8A8_SRGBin Vulkan) stores encoded bytes, and the GPU decodes them to linear every time a shader samples it, before filtering. - A framebuffer or swapchain image with an sRGB format encodes the shader's linear output when it's written (and blends in linear).
- Only textures that contain colors (albedo, base color, emission, UI images) are sRGB. Normal maps, roughness, metallic, height and mask textures store data, not colors, and must stay linear: decoding a normal map as sRGB bends every normal.
- Colors typed into a color picker are usually sRGB values too and need decoding before they're used as light amounts.
- With HDR rendering, the linear values can go far above 1 and are brought back into 0–1 by tone mapping before the encoding (chapter 15 and Part 2).
You'll set this up yourself in the OpenGL series, chapter 21 and do it by hand in a shader in the GLSL series, chapter 10.
3.8 Color temperature and white balance
Black bodies
Heat a piece of iron and it glows: first dull red, then orange, yellow, and at very high temperatures white and bluish.
An ideal object that absorbs all light and glows only because of its temperature is called a black body (黒体).
Its spectrum depends only on its absolute temperature in kelvin (K), and is given by Planck's law:
The temperature of the black body whose color matches a light is that light's color temperature (色温度).
In the chromaticity diagram, black bodies at all temperatures form a curve, the Planckian locus (黒体軌跡), running from red-orange at low temperatures through white to light blue.
For a light that isn't exactly on the curve (most lamps, and D65 itself, which sits just above it), we use the temperature of the nearest point, the correlated color temperature (相関色温度); D65's is about 6504 K.
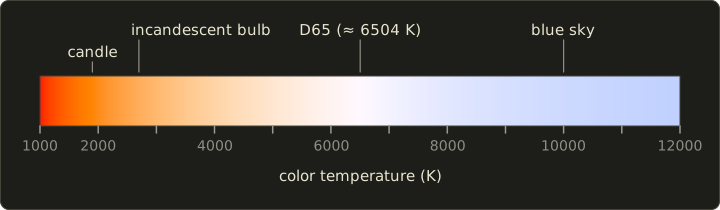
Typical values (all approximate): a candle about 1900 K, an incandescent bulb about 2700 K, direct midday sunlight about 5000–5500 K, average daylight about 6500 K (D65), and the light from a clear blue sky 10,000 K or more.
Note the confusing naming: lights with a low color temperature look warm (orange), and lights with a high color temperature look cool (bluish).
Worked example: where does a black body shine brightest?
Wien's displacement law gives the peak wavelength: with .
- An incandescent bulb at 2700 K: m nm. That's infrared, outside the visible range: most of the bulb's energy becomes heat, which is why these bulbs are so inefficient.
- The sun's surface, about 5800 K: nm, right in the middle of the visible range.
White balance
A white sheet of paper reflects whatever light falls on it, so under a 2700 K bulb it sends out orange-ish light.
Yet we still see it as white: the visual system adapts to the light and discounts its color.
This is color constancy (色の恒常性).
A camera has no such instinct, so it must be told what "white" is: that's white balance (ホワイトバランス).
The simplest method scales each channel so that a known gray or white object comes out neutral.
Worked example. Under warm light, a gray card is recorded as linear .
- Choose gains that make all channels equal to the green value: , , .
- Apply them to every pixel: the card becomes , neutral gray.
- Note that this happens on linear values: scaling encoded values would not be the same operation.
More careful methods (chromatic adaptation, for example the Bradford transform) do the scaling in a cone-like LMS space instead of in RGB, which matches human adaptation better.
In CG, you meet color temperature when you set up lights (many renderers and engines let you give a light's color in kelvin, using exactly this black-body curve), when you pick the white point of a scene, and when you composite CG into live-action footage, where the CG lights must match the white balance of the camera plate (chapter 14).
3.9 Visual perception for CG
Luminance and brightness
Luminance (輝度, unit cd/m²) is a physical quantity you can measure with an instrument.
Brightness (明るさ) is how bright something looks, a sensation.
The two are related, but not in a straight line, and the context changes the sensation a lot, as the next sections show.
The Weber–Fechner law
In the 19th century, Weber found that the smallest change we can notice, the just-noticeable difference, is a constant fraction of the starting intensity:
For luminance in good lighting, is roughly 1–2%.
Fechner concluded that the sensation grows with the logarithm of the intensity, : every doubling of the light adds the same amount of perceived brightness.
Together this is the Weber–Fechner law (ウェーバー・フェヒナーの法則).
It's only an approximation (it fails in very dark and very bright conditions, and later work prefers power laws like the cube root in ), but it explains a lot.
Worked example. Take .
- At 10 cd/m² we notice a change of cd/m². At 100 cd/m² we need cd/m².
- How many just-noticeable steps fit between 1 and 100 cd/m²? Each step multiplies by 1.02, so , .
- That's fewer than 256, so 8 bits are enough, if the codes are spaced by ratios.
- With linear 8-bit codes and a 100 cd/m² white, every step is cd/m². At 5 cd/m² that's a 7.8% jump (four times the threshold: visible bands), and at 100 cd/m² a 0.39% jump (five times finer than needed: wasted codes).
- With sRGB encoding, the steps are about 3.1% at 5% of white, 1.2% at 50% and 0.9% at white: much more even. That's section 3.7's "gamma is a compression trick" in numbers.
Contrast
Contrast (コントラスト) describes the difference between light and dark.
For displays it's usually given as the contrast ratio (コントラスト比) : a monitor with a 300 cd/m² white and a 0.3 cd/m² black has .
Because of the Weber–Fechner law, the ratio matters more than the difference.
Mach bands
Look at the strip below: a flat dark area, a smooth ramp and a flat light area.
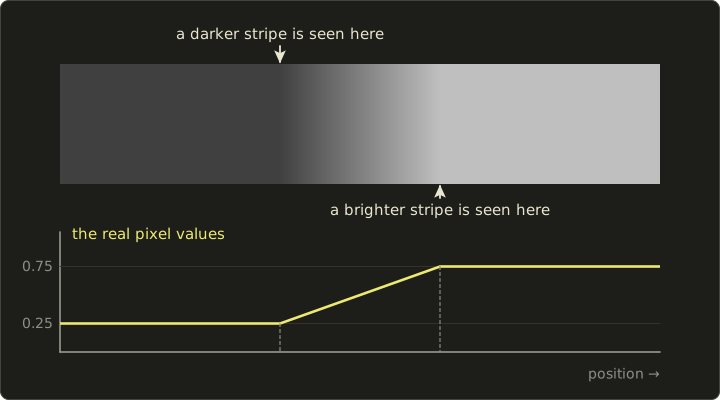
Most people see a thin darker stripe where the ramp begins and a brighter stripe where it ends.
The plot underneath shows the real pixel values: there are no stripes, only corners.
These illusory stripes are Mach bands (マッハバンド), described by Ernst Mach in 1865.
They come from lateral inhibition (側抑制) in the retina: neighboring cells suppress each other, which sharpens edges and exaggerates every sudden change in the slope of the brightness.
This has a direct consequence for CG.
Gouraud shading (chapter 10) interpolates brightness linearly across each polygon.
The brightness is continuous across an edge, but its slope jumps, so the eye adds Mach bands along the polygon edges and the mesh structure becomes visible, even though nothing is wrong in the numbers.
Smoother shading (Phong shading, more polygons) reduces the effect.
Simultaneous contrast and other illusions
The perceived brightness of a region depends on its surroundings.
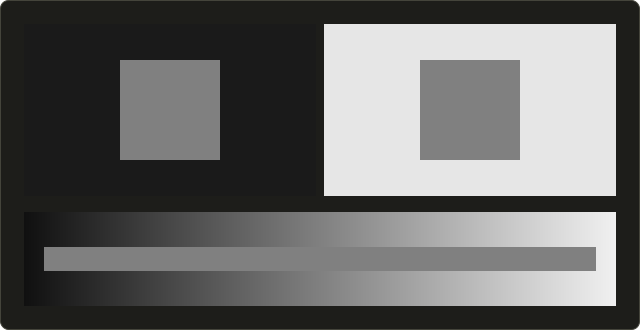
Both squares above have exactly the same pixel value (128, 128, 128), and the bar below is one single gray, yet the square on black looks lighter and the bar seems to darken toward the right.
This is simultaneous contrast (同時対比).
The same happens with hue: a gray patch on a red background looks slightly greenish.
In practice, judge colors on a neutral background, and remember that the UI colors around a 3D viewport change how the render looks.
Many other visual illusions (錯視), of size, length and motion, also exist; chapter 18 returns to perception in more detail.
How fine and how fast the eye sees
Spatial resolution. Visual acuity (視力) 1.0 means that you can separate details 1 arcminute (1/60 of a degree) apart.
On a screen viewed from 50 cm, 1 arcminute is mm, which is pixels per inch.
Beyond that pixel density, individual pixels can't be seen at that distance, which is the idea behind "retina" displays.
It also tells us when anti-aliasing (chapter 2) matters: the bigger the pixels look, the more visible the jaggies.
Temporal resolution. A light that flickers fast enough looks steady.
The frequency where this happens is the critical flicker frequency (臨界融合周波数, CFF), roughly 50–60 Hz for a bright light (higher for brighter lights and at the edge of vision).
That's why cinema projectors show each of the 24 frames per second two or three times (48 or 72 flashes per second), and why displays refresh at 60 Hz or more, and VR headsets at 90 Hz or more.
Separately, a sequence of still images with small differences is seen as motion: apparent motion (仮現運動) is what makes animation work at all.
Too few frames per second for fast motion gives stutter and temporal aliasing, which motion blur hides (chapter 2).
Depth cues
A screen is flat, yet CG images look three-dimensional.
The brain judges depth from many depth cues (奥行き手がかり), and CG reproduces them one by one:
| Depth cue | Eyes | How CG produces it |
|---|---|---|
| Binocular disparity (両眼視差) | two | Stereo rendering: one image per eye (chapter 17) |
| Convergence (輻輳) | two | Stereo displays; the eyes turn inward for near objects |
| Accommodation (調節) | one | Focusing of the eye's lens; depth of field imitates it (chapter 2) |
| Motion parallax (運動視差) | one | Near things move faster when the camera or head moves; head tracking in VR |
| Occlusion (重なり, 遮蔽) | one | Hidden surface removal (chapter 10) |
| Linear perspective (線遠近法) | one | Perspective projection (chapter 5) |
| Relative and familiar size | one | Perspective projection: farther objects are drawn smaller |
| Texture gradient (きめの勾配) | one | Texture mapping in perspective (chapter 11) |
| Shading and shadows (陰影) | one | Shading and shadows (chapters 10 and 11) |
| Atmospheric perspective (大気遠近法) | one | Fog and haze that make far objects paler and bluer |
Binocular disparity, convergence and accommodation are physiological cues (生理的手がかり); the pictorial ones like perspective and shading work in any single photograph or painting.
Normally all cues agree.
In a VR headset, the eyes converge on a virtual object at, say, 50 cm, but must focus on the fixed optical distance of the display: the vergence–accommodation conflict (輻輳調節矛盾), one of the causes of eye strain and VR sickness.
Stereo and VR displays come back in chapter 17.
3.10 Code samples and exam points
The code is optional: everything in this chapter can be done with a calculator.
It shows the sRGB curves, RGB → HSV and luma in C++20, using Vec3 and dot from the linear algebra library, because luma is just a dot product with the weight vector.
C++: sRGB, HSV and luma
#include <algorithm>
#include <cmath>
#include <cstdio>

#include "linalg.hh"

// sRGB(IEC 61966-2-1)の符号化:リニア → sRGB / encode: linear → sRGB
float srgbEncode(float l) {
  l = std::clamp(l, 0.0f, 1.0f);
  if (l <= 0.0031308f) return 12.92f * l;
  return 1.055f * std::pow(l, 1.0f / 2.4f) - 0.055f;
}

// sRGBの復号:sRGB → リニア / decode: sRGB → linear
float srgbDecode(float v) {
  v = std::clamp(v, 0.0f, 1.0f);
  if (v <= 0.04045f) return v / 12.92f;
  return std::pow((v + 0.055f) / 1.055f, 2.4f);
}

// RGB → HSV。戻り値は {H(度), S, V} / returns {H (degrees), S, V}
Vec3 rgbToHsv(Vec3 c) {
  float mx = std::max({c.x, c.y, c.z});
  float mn = std::min({c.x, c.y, c.z});
  float d = mx - mn;
  float h = 0.0f;
  if (d > 0.0f) {
    if (mx == c.x) h = 60.0f * std::fmod((c.y - c.z) / d + 6.0f, 6.0f);
    else if (mx == c.y) h = 60.0f * ((c.z - c.x) / d + 2.0f);
    else h = 60.0f * ((c.x - c.y) / d + 4.0f);
  }
  float s = mx > 0.0f ? d / mx : 0.0f;
  return {h, s, mx};
}

// ルーマは重み付きの和、つまり内積 / luma is a weighted sum, i.e. a dot product
float luma601(Vec3 c) { return dot(c, Vec3{0.299f, 0.587f, 0.114f}); }
float luma709(Vec3 c) { return dot(c, Vec3{0.2126f, 0.7152f, 0.0722f}); }

int main() {
  float e = srgbEncode(0.5f);
  printf("linear 0.5 -> sRGB %.4f -> 8-bit %d\n", e, (int)std::lround(e * 255.0f));
  printf("8-bit 128  -> linear %.4f\n", srgbDecode(128.0f / 255.0f));

  Vec3 c{0.8f, 0.4f, 0.2f};
  Vec3 hsv = rgbToHsv(c);
  printf("HSV of (0.8, 0.4, 0.2) = (%.1f deg, %.2f, %.2f)\n", hsv.x, hsv.y, hsv.z);
  printf("luma BT.601 = %.4f, BT.709 = %.4f\n", luma601(c), luma709(c));
  return 0;
}
Output, matching the worked examples above:
linear 0.5 -> sRGB 0.7354 -> 8-bit 188
8-bit 128  -> linear 0.2159
HSV of (0.8, 0.4, 0.2) = (20.0 deg, 0.75, 0.80)
luma BT.601 = 0.4968, BT.709 = 0.4706
In rgbToHsv, adding 6 before fmod keeps the red sector's hue positive (C++'s fmod keeps the sign of a negative input).
Shader: linear → sRGB
When the framebuffer isn't an sRGB format, a post-processing shader encodes the final color itself.
This version handles all three channels at once without branches: step gives 1 where the value is in the straight-line part, and the blend picks that branch there.
float3 linearToSrgb(float3 c) {
  c = saturate(c);
  float3 lo = 12.92 * c;
  float3 hi = 1.055 * pow(c, float3(1.0 / 2.4)) - 0.055;
  return lerp(hi, lo, step(c, float3(0.0031308)));
}
vec3 linearToSrgb(vec3 c) {
c = clamp(c, 0.0, 1.0);
vec3 lo = 12.92 * c;
vec3 hi = 1.055 * pow(c, vec3(1.0 / 2.4)) - 0.055;
return mix(hi, lo, step(c, vec3(0.0031308)));
}float3 linearToSrgb(float3 c) {
c = saturate(c);
float3 lo = 12.92 * c;
float3 hi = 1.055 * pow(c, (float3)(1.0 / 2.4)) - 0.055;
return lerp(hi, lo, step(c, (float3)0.0031308));
}Use it only when the framebuffer is not an sRGB format; with an sRGB framebuffer the hardware encodes for you, and encoding twice makes everything washed out.
Exam points
- Additive vs subtractive. Additive (light, displays): primaries R, G, B; R + G = yellow, G + B = cyan, B + R = magenta, all = white. Subtractive (inks, filters): primaries C, M, Y; C + M = blue, M + Y = red, Y + C = green, all = black. and so on.
- Rods vs cones. Rods: dim light, no color. Cones: three types (S, M, L), color, daylight, concentrated in the fovea.
- Metamerism (条件等色): different spectra, same color.
- The chromaticity diagram: the axes are and , not R and G. The curved edge is the spectral locus, the straight edge the purple line. Luminance is not visible in xy. Mixtures lie on straight lines; a display's gamut is a triangle.
- Y in XYZ is luminance, because .
- Which coefficients: BT.601: 0.299, 0.587, 0.114. BT.709 (and sRGB): 0.2126, 0.7152, 0.0722. Green is always the largest.
- Gamma direction: a display turns signal into light with (darkening the mid-tones); encoding uses the inverse (brightening them). Linear 0.5 is about 188 in 8-bit sRGB; 128 is only about 22% of the light.
- Do math in linear space, encode at the end.
- Color temperature: low = reddish ("warm"), high = bluish ("cool"); D65 ≈ 6500 K.
- Weber's law: is constant. Mach bands appear where the slope of brightness changes (Gouraud shading).
3.11 Summary
- Light is an electromagnetic wave; visible light spans roughly 380–780 nm, and a light or surface is described by its spectral distribution.
- The retina has rods (dim light, no color) and three cone types (S, M, L). The eye reduces every spectrum to three numbers, which is why three primaries suffice and why metamers exist.
- Additive mixing (RGB, light) gets brighter, subtractive mixing (CMY, inks) gets darker; , and printers add K.
- CIE XYZ is the device-independent color system; Y is luminance. The xy chromaticity diagram shows the spectral locus, the purple line, white points and gamut triangles; sRGB uses the BT.709 primaries and D65.
- HSV/HSL describe colors by hue, saturation and value/lightness, convenient for people, but not perceptually accurate.
- Video separates luma and chroma (BT.601: 0.299/0.587/0.114, BT.709: 0.2126/0.7152/0.0722) so that chroma can be subsampled (4:2:2, 4:2:0).
- Images are stored gamma-encoded (sRGB: a straight line plus a 2.4 power, close to gamma 2.2); lighting and blending must be done in linear space.
- Color temperature describes light by the black body of the same color; white balance scales the channels so that white looks white.
- Perception: brightness follows ratios (Weber–Fechner), Mach bands and simultaneous contrast fool us, the eye resolves about 1 arcminute and fuses flicker above roughly 50–60 Hz, and CG imitates the depth cues one by one.
3.12 Key terms
| English | 日本語 |
|---|---|
| visible light | 可視光 |
| wavelength | 波長 |
| spectral distribution | 分光分布 |
| retina | 網膜 |
| rod / cone | 桿体/錐体 |
| photopic / scotopic vision | 明所視/暗所視 |
| trichromatic theory | 三色説 |
| opponent-process theory | 反対色説 |
| metamerism | 条件等色(メタメリズム) |
| color vision deficiency | 色覚異常 |
| additive mixing | 加法混色 |
| subtractive mixing | 減法混色 |
| primary color | 原色 |
| color matching function | 等色関数 |
| tristimulus values | 三刺激値 |
| XYZ color system | XYZ表色系 |
| luminous efficiency function | 標準比視感度 |
| chromaticity | 色度 |
| chromaticity diagram | 色度図 |
| spectral locus | スペクトル軌跡 |
| purple line | 純紫軌跡 |
| white point | 白色点 |
| gamut | 色域 |
| three attributes of color | 色の三属性 |
| hue / saturation / value (lightness) | 色相/彩度/明度 |
| luminance | 輝度 |
| luma | ルーマ |
| color difference | 色差 |
| chroma subsampling | クロマサブサンプリング(色差サブサンプリング) |
| gamma correction | ガンマ補正 |
| black body | 黒体 |
| color temperature | 色温度 |
| correlated color temperature | 相関色温度 |
| white balance | ホワイトバランス |
| color constancy | 色の恒常性 |
| Weber–Fechner law | ウェーバー・フェヒナーの法則 |
| contrast | コントラスト |
| Mach band | マッハバンド |
| lateral inhibition | 側抑制 |
| simultaneous contrast | 同時対比 |
| visual acuity | 視力 |
| critical flicker frequency | 臨界融合周波数 |
| apparent motion | 仮現運動 |
| depth cue | 奥行き手がかり |
| binocular disparity | 両眼視差 |
| convergence / accommodation | 輻輳/調節 |
| motion parallax | 運動視差 |
3.13 Challenges
- ★ Convert RGB to CMY, then to CMYK with . Which ink ends up at 0?
- ★ Encode linear 0.18 and linear 0.002 to 8-bit sRGB (watch which branch of the curve applies), and decode the 8-bit value 200 to linear.
- ★ Convert RGB to HSV and to HSL, and convert HSV back to RGB.
- ★★ Using the sRGB matrix, compute the xy chromaticity of pure green , pure blue and cyan . Show that cyan lies on the line from green to blue, and at which fraction of the way.
- ★★★ Assume a Weber fraction of 2% and a display whose white is 400 cd/m² and whose black is 0.4 cd/m². How many just-noticeable steps fit between black and white? Is an 8-bit encoding with ideally spaced codes enough, and what does this suggest for HDR displays with a much larger contrast ratio?
Multiple choice
Q1 ★ Which of the following statements about color mixing is correct?
| A | The additive primaries are cyan, magenta and yellow. |
| B | Mixing cyan ink and magenta ink gives green. |
| C | Mixing the three subtractive primaries at full strength gives white. |
| D | A display shows colors by subtractive mixing of cyan, magenta and yellow subpixels. |
| E | Mixing red light and green light gives yellow light. |
Q2 ★★ Which of the following statements about the CIE 1931 xy chromaticity diagram is correct?
| A | The x axis is the R value and the y axis the G value of an sRGB color. |
| B | The curved edge is made of monochromatic lights, while the colors on the straight edge joining its two ends cannot be produced by any single wavelength. |
| C | Every color inside the horseshoe-shaped region can be shown on a display with sRGB primaries. |
| D | The luminance of a color can be read off from its position in the diagram. |
| E | Mixing two lights always gives the color at the exact midpoint between their two points. |
Q3 ★★ A renderer computes a linear light value of 0.5 (half of white) for a pixel and writes it to an 8-bit sRGB image. Which stored value is closest?
| A | 188 |
| B | 64 |
| C | 218 |
| D | 128 |
| E | 160 |
3.14 Practical assignment
A color card on graph paper.
You need graph paper (at least 20 × 20 cm), a ruler, colored pencils and a calculator.
You'll draw your own chromaticity diagram and place three colors on it, computing everything we did in this chapter by hand.
The three colors, given as linear sRGB values: P = , Q = , and R = .
- Step 1 (axes). Draw an x axis from 0 to 0.8 and a y axis from 0 to 0.9 with 1 cm = 0.05 (so 16 cm by 18 cm).
- Step 2 (spectral locus). Plot these points of the CIE 1931 spectral locus and join them with a smooth curve: 380 nm (0.1741, 0.0050), 460 nm (0.1440, 0.0297), 480 nm (0.0913, 0.1327), 490 nm (0.0454, 0.2950), 500 nm (0.0082, 0.5384), 520 nm (0.0743, 0.8338), 540 nm (0.2296, 0.7543), 560 nm (0.3731, 0.6245), 580 nm (0.5125, 0.4866), 600 nm (0.6270, 0.3725), 700 nm (0.7347, 0.2653). Close it with a straight dashed purple line from 380 nm to 700 nm.
- Step 3 (gamut). Plot the sRGB primaries and D65 from the table in section 3.4, and draw the sRGB triangle.
- Step 4 (XYZ and xy). For P, Q and R, compute X, Y, Z with the sRGB matrix, then x and y. Plot the three points and label them.
- Step 5 (encoding). For each color, compute the 8-bit sRGB values with the encoding curve, and from those encoded values (divided by 255) the HSV values and the BT.709 luma . Write a small table: linear RGB, XYZ, xy, 8-bit sRGB, HSV, , and true luminance Y.
- Step 6 (mixing). Add P and Q (linear values, component by component), compute the xy of the mixture, and plot it. Compute the fraction , where is of each color, and check that the mixture is at that fraction of the way from P to Q.
- Step 7 (color it in). Using colored pencils, roughly color the inside of the sRGB triangle (red, green and blue corners, white near D65), and shade the region between the triangle and the locus lightly in gray: "exists, but can't be shown on an sRGB screen".
How to check your results:
- R is a gray, so its xy must be exactly D65 (0.3127, 0.3290), its HSV saturation must be 0, and its true luminance Y must equal 0.25.
- P, Q and R must lie inside the sRGB triangle, and P must lie on the edge between the red and green corners.
- The mixture of P and Q must lie on the straight segment from P to Q, at your computed fraction (measure it with the ruler).
- For Q and R, (from encoded values) and the true Y (from linear values) differ: if you get the same number, you mixed up the two spaces. (For P they agree, because P is made only of 0s and 1s, which the encoding leaves unchanged.)
コメント(0)
まだコメントはありません。
ログインするとコメント出来ます。